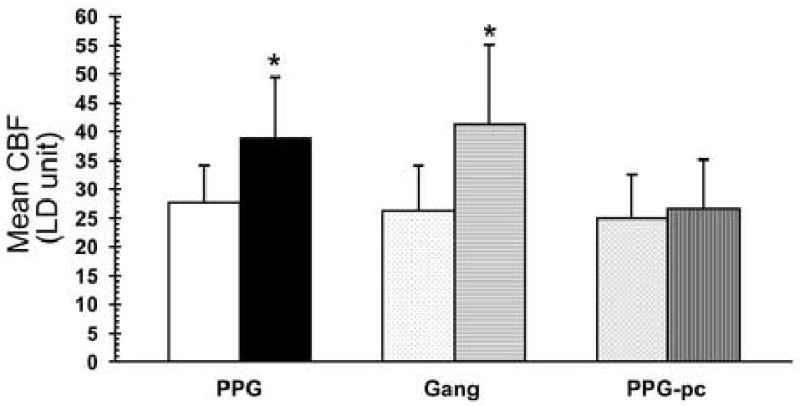
Figure 2.

Graphic representation of changes in CBF (LD units) in response to electrical stimulation of the PPG (left), ganglionic fibers from PPG (Gang; center), or the PPG after transection of ganglionic fibers (PPG-pc; right). In each case basal values are shown to the left and responses to electrical stimulation are shown to the right. * p<0.05
