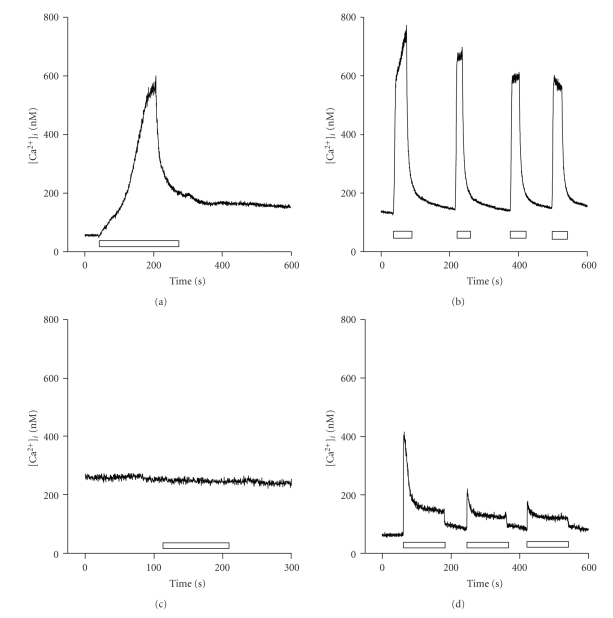
Figure 2.
Effect of caffeine on [Ca2+]i in isolated myoblasts and myotubes. Representative traces show the typical time course of the response to 20 mM caffeine observed in (a) wild type (+/+) myoblast; (b) wild type (+/+) myotube; (c) capn3-deficient (−/−) myoblast; (d) capn3-deficient (−/−) myotube. The duration of drug exposure is represented (open bars).

