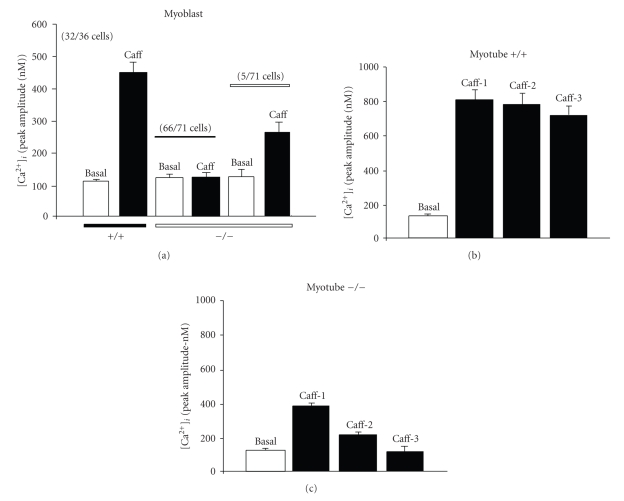
Figure 3.
Peak amplitude of [Ca2+]i response of myoblasts and myotubes to caffeine. Bar diagrams summarize the response of the cell types shown in Figure 2. (a) myoblasts (+/+ and −/−): single application of 20 mM caffeine; (b) myotubes (+/+); (c) myotubes (−/−): 3 successive applications of 20 mM caffeine. The number of cells pooled in a category and the total number of cells tested are given in brackets.

