
Figure 3.
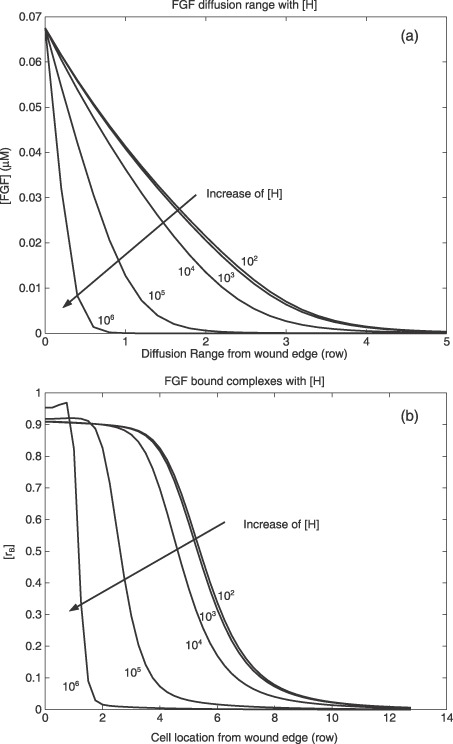
Diffusion range of (a) FGF and (b) normalized FGF‐bound complexes on cell surfaces versus initial concentration of cell‐surface HSPG (receptor/cell). Diffusion ranges are predicted by the mathematical model and are plotted as number of cell rows from wound edge at 60 s after injury. Normalized FGF‐bound complexes are plotted versus cell location starting from wound edge. FGF, fibroblast growth factor; HSPG, heparan sulfate proteoglycan; VEGF, vascular endothelial growth factors.