
Figure 1. Methylation status of CpG sites within 5’-flanking region of EC-SOD gene.
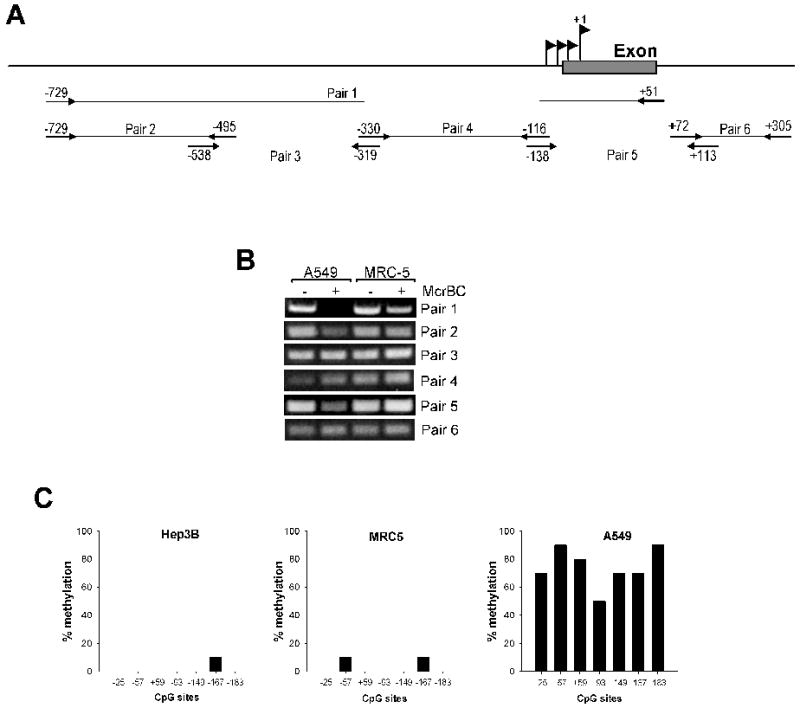
A, Schematic representation of primers used for amplification of EC-SOD 5’-flanking region in McrBC based assay. B, genomic DNA from A549 and MRC5 was purified and digested with McrBC methylation sensitive nuclease. The integrity of DNA was analyzed using primers pairs (depicted in panel A) that amplify different region of EC-SOD promoter. Amplified products were separated on 1.2% agarose gel and visualized using ethidium bromide under UV light. C, sodium bisulfite sequencing of the EC-SOD promoter. Genomic DNA from Hep3B, A549 and MRC5 cells was isolated, bisulfite-treated and amplified by PCR using primers targeting EC-SOD promoter region. The amplified sequences were subjected to DNA sequence analysis as described under “Material and Methods”. At least 10 individual clones were sequenced for each cell type.