
Figure 5. Analysis of EC-SOD promoter occupancy by RNA polymerase II, Sp3, MeCP2 and MBD following 5-aza-dC treatment.
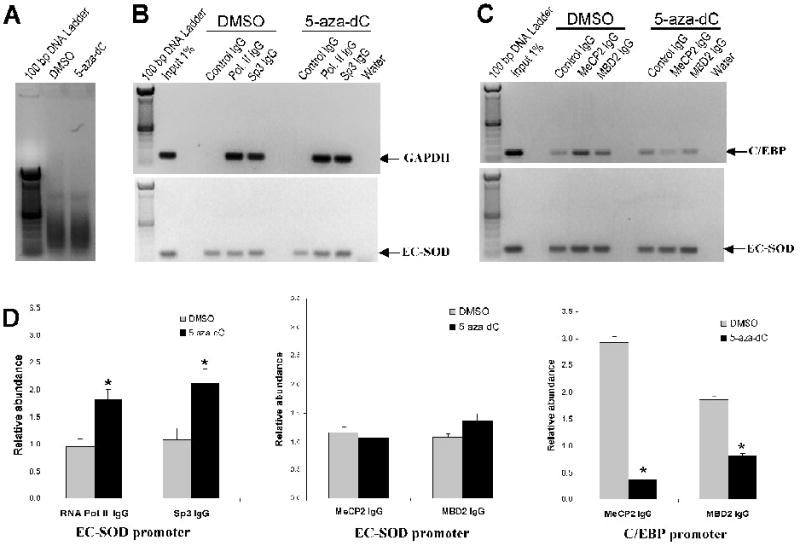
Chromatin immunoprecipitation assay was used to analyze the interaction of RNA Polymerase II (RNA Pol. II), Sp3, MeCP2 and MBD2 with the EC-SOD proximal promoter in A549 cells untreated or treated with 1 μM of 5-aza-dC for 4 days. A, The molecular size of shared genomic DNA from A549 cells treated with DMSO or 5-aza-dC. B, Occupancy of EC-SOD promoter by RNA Polymerase II and Sp3 was analyzed using ChIP assay. The binding of RNA polymerase II and Sp3 to the GAPDH promoter was used as a positive control. C, Effect of 5-aza-dC on binding of MeCP2 and MBD2 to EC-SOD promoter in vivo. Binding of these proteins to the C/EBP promoter was used as a positive control. Gel images shown here are representative of at least three independent experiments. D, Quantitative analysis of images presented in panel B & C. The intensity of fluorescence from amplified bands was compared and expressed as relative abundance of the protein at corresponding promoter. Asterisks indicate amplified bands whose intensity is significantly higher than the intensity of corresponding control IgG bands. (P < 0.05). Bars represent ±SD