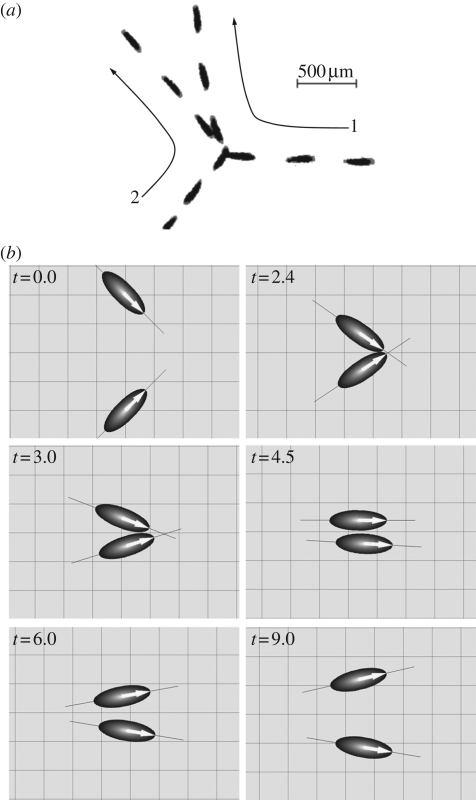
Figure 5.
Comparison between experimental and numerical results for the hydrodynamic interaction between two swimming P. caudatum. (a) A sample sequence showing the hydrodynamic interaction between two swimming P. caudatum that experience a near contact in a fluid layer between flat plates. The time interval between sequential images is 1/3 s. Long arrows are added to schematically illustrate cell motion. (b) A sample sequence showing the hydrodynamic interaction between two squirmer models. The orientation vectors of the squirmers are denoted by large arrows on the ellipsoids, and a thin solid line is added so that one can easily visualize the angle between the two squirmers (reproduced with permission from Ishikawa & Hota 2006).

