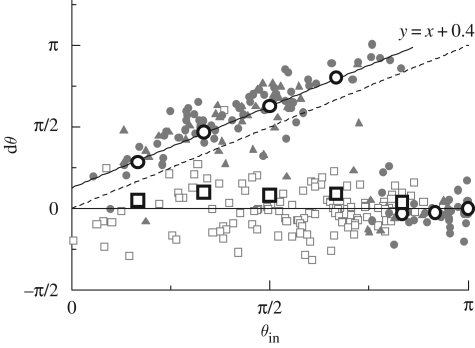
Figure 6.
Comparison of the experimental and simulation results for dθ, where dθ is the change in the angle of cell 2 relative to cell 1 after near contact, and θin is the angle between the orientation vectors of the cells before the near contact. The experimental results are plotted with grey symbols (filled circle, head–head; filled triangle, head–body; open square, head–tail; dotted line, y = x), and the numerical results are plotted with large circles (head–head) and squares (head–tail). The broken line with slope = 1 and the solid lines dθ = 0 and dθ = θin + 0.4 are added for comparison. In the figure, head, body and tail indicate the collision position on the cell body (reproduced with permission from Ishikawa & Hota 2006).

