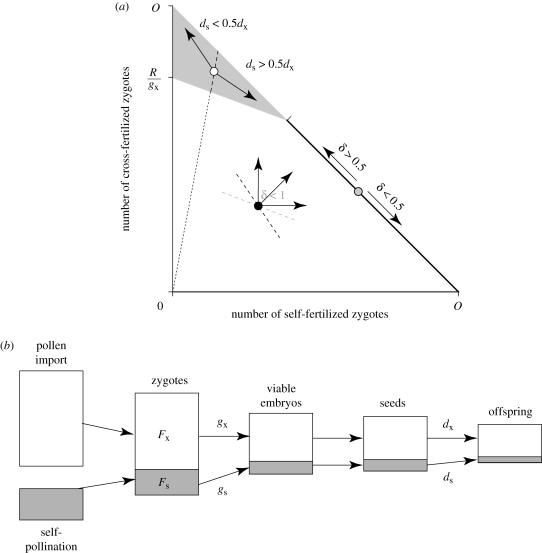
Figure 1.
Graphical model of (a) the limits on total seed production and (b) the reproductive transitions considered in the model of selection on reproductive traits (which also considers outcross siring success). Panel a illustrates combinations of cross-fertilization (Fx) and self-fertilization (Fs) that result in PL (white area below diagonal), ovule limitation (heavy diagonal line) and resource limitation (grey area) of seed production (areas above the diagonal are not possible) given that 30 and 80% of selfed and outcrossed zygotes survive genetic death to become embryos (i.e. gs = 0.3, gx = 0.8), maternal plants have sufficient resources to mature 60% of their ovules into seeds (R/O = 0.6) and the probability that selfed seeds establish reproductive offspring is 70% that for outcrossed seeds (ds/dx = 0.7). The arrows projecting from the black, grey and white symbols illustrate examples of possible directions of evolution under pollen, ovule and resource limitation, respectively, and the associated equations relate necessary conditions for inbreeding depression. The slope of the dashed line projecting from the origin is Fx/Fs, which is a selection threshold under resource limitation (see equation (4.3)). The black dashed line through the pollen-limited (i.e. black) point is its associated fitness isocline: selection can move the mating system only to the right of this isocline. The grey dashed line through the same point is the seed-production isocline. In panel (b) the height of each block depicts the number of entities (pollen, zygotes, etc.) during each reproductive stage, with white and grey areas representing outcrossed and selfed fractions, respectively.

