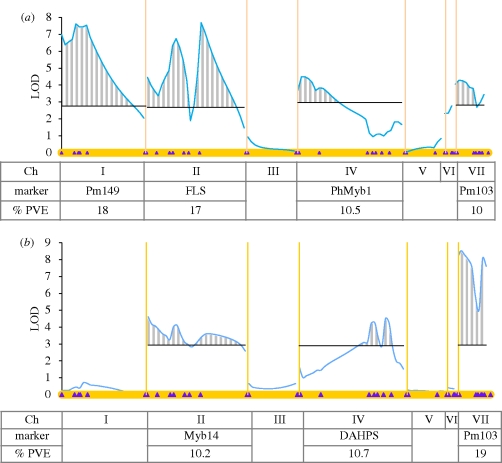
Figure 6.
QTL analysis (composite interval mapping) of limb surface and D1 length. (a) Limb surface and (b) tube length (D1). The seven linkage group are represented horizontally (as the X axis), and separated by yellow vertical lines. Purple diamonds indicate marker positions along each linkage groups. LOD scores for the position of the QTLs are plotted as the blue line. LOD significance thresholds (α = 0.05) are indicated by single dark horizontal lines. Significant QTLs regions detected by CIM (above LOD thresholds) are represented with a grey stripy pattern. Table underneath indicates chromosome numbers (Ch), name of the marker with the highest percentage of phenotypic variation (%PVE; p < 0.001 for all values).

