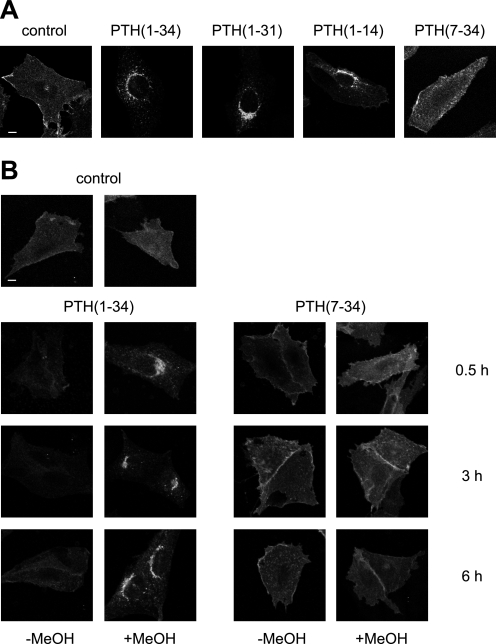
FIGURE 1.
Ligand-induced internalization of the PTHR. A, CHO cells stably expressing HA-PTHR were treated with 100 nm PTH(1–34), 1 μm PTH(1–31), 3 μm PTH(1–14), or 1 μm PTH(7–34) for 30 min. Subsequently, the cells were fixed, permeabilized, and stained with mouse anti-HA antibody followed by a Cy2-labeled anti-mouse antibody. HA-PTHR was visualized by confocal microscopy. B, CHO cells stably expressing HA-PTHR were left untreated (control) or were treated with 100 nm PTH(1–34) or 1 μm PTH(7–34) for 30 min, 3 h, or 6 h. The cells were fixed and either permeabilized with MeOH or left unpermeabilized. White scale bars represent 5 μm. PTHR was visualized as described above.

