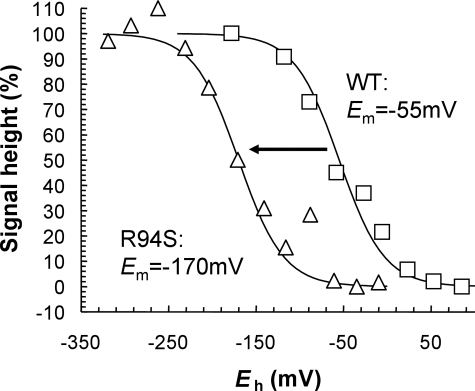
FIGURE 6.
Potentiometric titration of FS0 in the NarG-R94S variant. Shown is a plot of the intensity of the FS0 signal in wild-type (WT) NarGHI (squares) and the NarG-R94S variant (triangles) versus Eh. Data were fit to single n = 1.0 components with Em values of −55 mV (wild-type) and −170 mV (NarG-R94S), respectively.

