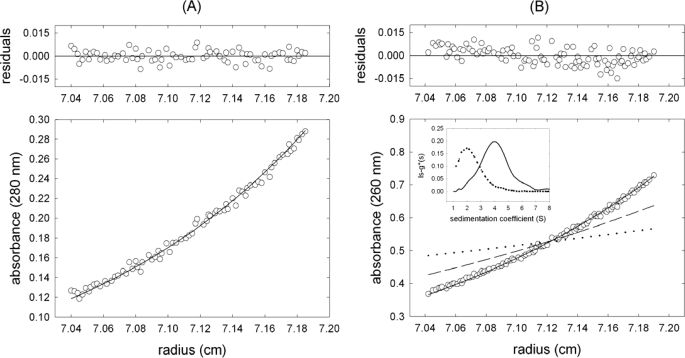
FIGURE 2.
Stoichiometry of TrwCR-R(25 + 0) complexes in solution. A, sedimentation equilibrium gradient (15,000 rpm, 20 °C) of 6 μm TrwCR. The symbols represent the experimental data, and the solid line shows the best fit gradient, with an average molar mass of 32,900 ± 3,000 Da, which is essentially the monomer mass. B, the symbols represent the sedimentation equilibrium gradient (13,000 rpm, 20 °C) of a mixture of 2.0 μm TrwCR with 1.5 μm R(25 + 0) oligonucleotide. The solid line is the best fit gradient to a single sedimenting species of 44,000 Da molar mass. For comparative purposes, the theoretical gradients of monomer TrwCR (dashed line) and R(25 + 0) oligonucleotide (dotted line) are also shown. Inset, apparent sedimentation coefficient distributions, g*(s), at 50,000 rpm and 20 °C for 1.5 μm R(25 + 0) alone (dashed line) and in the presence of 2.0 μm TrwCR (solid line).

