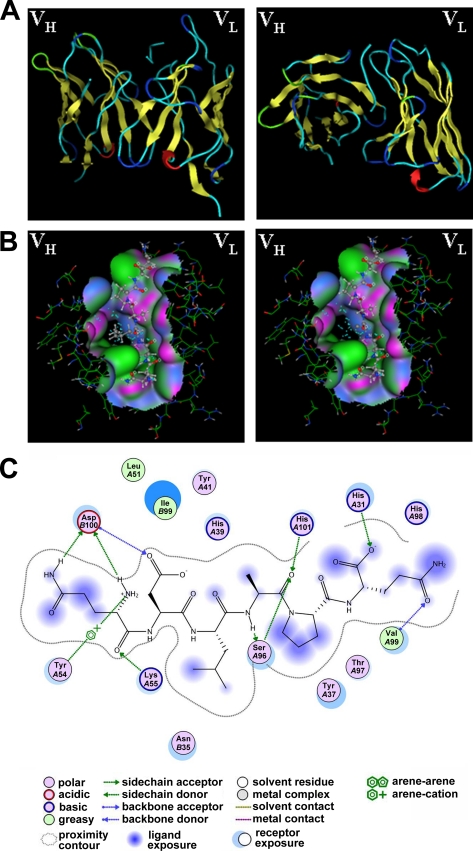
FIGURE 7.
Computational simulation of AD5-10 epitope recognition. A, overall structure of AD5-10-epitope complex, side view (left), and top view (right). B, comparison of the wild-type core epitope (QDLAP, left) and the mutant epitope (QDAAP, right) in the binding pocket of AD5-10. C, ligand interaction plot for core epitope bound to AD5-10. All the diagrams were generated using the molecular operating environment 2006.08 (Chemical Computing Group, Montreal) Ligand Interactions Module.

