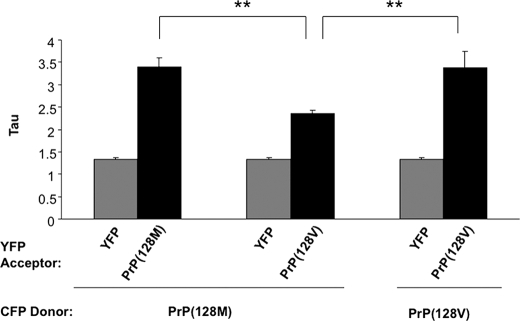
FIGURE 4.
Live cell FRET analysis following co-expression of mouse PrP pairs homologous and heterologous at residue 128. PrP-128M::CFP was co-expressed with YFP, PrP-128M::YFP, or PrP-128V::YFP for 16 h and analyzed by FRET microscopy, as described under “Materials and Methods.” Actual Tau measures are plotted, and are recorded in Table 2. Higher Tau values represent higher FRET. Heterologous pairs displayed significantly reduced FRET compared with homologous pairs. Each bar represents the mean ± S.E. of a total of 35 to 50 separate measurements. **, p < 0.01.

