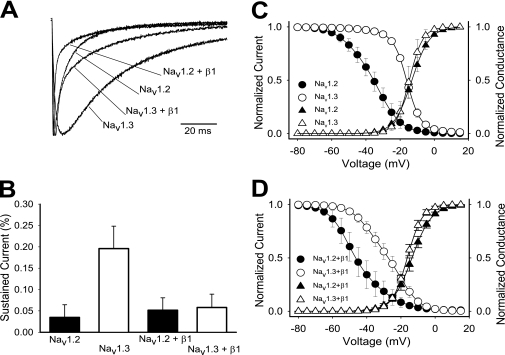
FIGURE 1.
Differences between Nav1.2 and Nav1.3. A, representative sodium currents recorded at room temperature using the two-electrode voltage clamp on Xenopus oocytes expressing either wild-type Nav1.2, Nav1.3, Nav1.2 + β1, or Nav1.3 + β1. Traces shown were elicited by a −10 mV depolarization from a holding potential of −100 mV and normalized to the peak current amplitude. B, the percentage of residual current was determined by dividing the average current during the last 10 ms of each depolarization by the peak current of the corresponding trace. Sample sizes were 6 for Nav1.2, 8 for Nav1.3, 6 for Nav1.2 + β1, and 5 for Nav1.3 + β1. C, the voltage dependences of inactivation (circles) and activation (triangles) for the wild-type Nav1.2 and Nav1.3 channels expressed as α subunits alone. D, the voltage dependences of inactivation (circles) and activation (triangles) for the wild-type Nav1.2 and Nav1.3 channels expressed as α + β1. The data points represent means, and the error bars indicate S.D. values. The data in C and D were fit with a two-state Boltzmann equation as described under “Experimental Procedures,” and the parameters of the fits are shown in Table 1.

