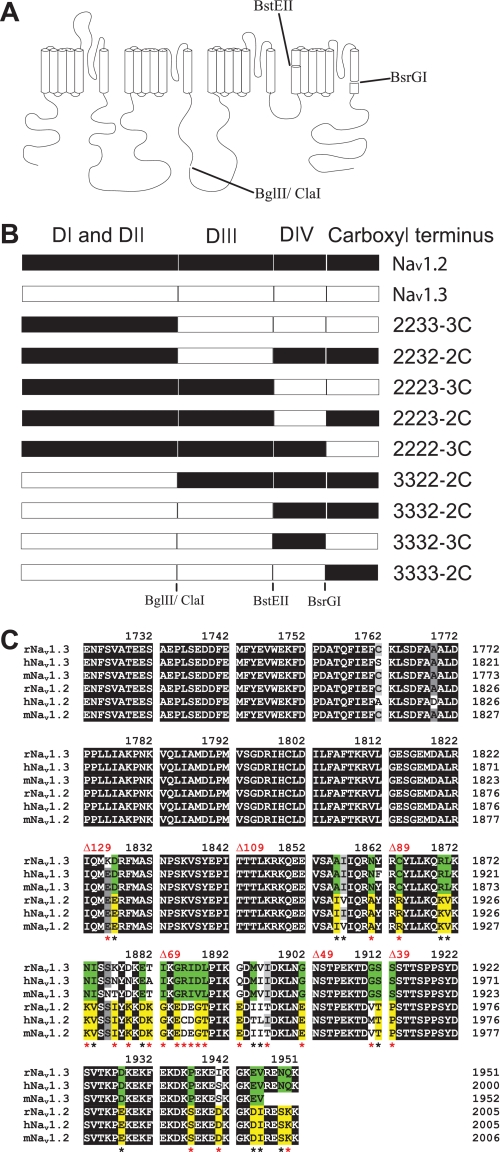
FIGURE 3.
Schematic diagram of the mutant channels. A, representation of the different channel domains and the restriction endonucleases that were used to make the chimeras between Nav1.2 and Nav1.3. B, diagram of the chimeras indicating the origin from either Nav1.2 (black) or Nav1.3 (white). C, amino acid sequence alignment of the carboxyl-terminal region for Rattus norvegicus (r), Homo sapiens (h), and Mus musculus (m) Nav1.3 and Nav1.2 sodium channels. Black, dark gray, and gray boxes indicate identical, highly conserved, and conserved residues, respectively. Green boxes illustrate Nav1.3-specific residues, and yellow boxes illustrate Nav1.2-specific residues. Asterisks indicate amino acid differences between rat Nav1.3 and Nav1.2 isoforms, including charge-changing differences (red asterisks). The sites of the truncations are indicated in red.

