FIGURE 3.
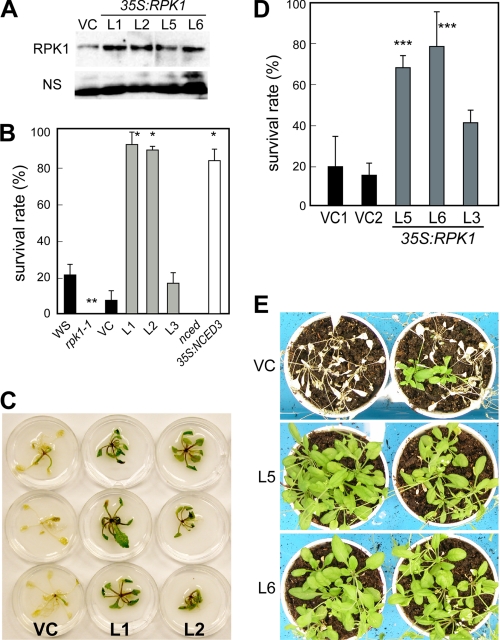
Drought tolerance of the 35S:RPK1 plants. A, protein blot analysis was performed with microsomal fractions of the 35S:RPK1 transgenic plants (lines L1, L2, L5, and L6) using an anti-RPK1 antibody. NS, nonspecific proteins. B and C, enhanced tolerance to rapid drought stress in the 35S:RPK1 (lines L1 and L2) plants. Transgenic plants, including vector control (VC), grown on GM-agar plates under normal conditions were transferred onto filter paper, and water was withheld for 8 h under 40% RH conditions. After drought stress treatment, the plants were watered and incubated for a further 2 days and then photographed (B). Survival rates were determined as the number of visible green plants after rehydration (C), and 20 plants were used in each experiment. Values are the means ± S.D. calculated from the results of three independent experiments. Bars, 1.0 cm. D and E, enhanced tolerance to long term drought stress in the 35S:RPK1 (lines L5 and L6) plants. The transgenic plants were grown on pots under normal conditions, and water was withheld for 2 weeks in 30–40% RH conditions. After this drought stress treatment, the plants were watered and incubated for 1 week and then photographed (D). Survival rates were determined as the number of visible green plants after rehydration (E), and 20 plants were used in each experiment. Values are the means ± S.D. calculated from the results of three independent experiments. The asterisks indicate statistically significant differences in comparisons between WS and rpk1-1, determined by Student's t test, or in comparisons between VC, 35S:RPK1, and 35S:NCED3, evaluated by one-way ANOVA with Tukey's HSD (*, p < 0.0001; **, p < 0.005; ***, p < 0.05).

