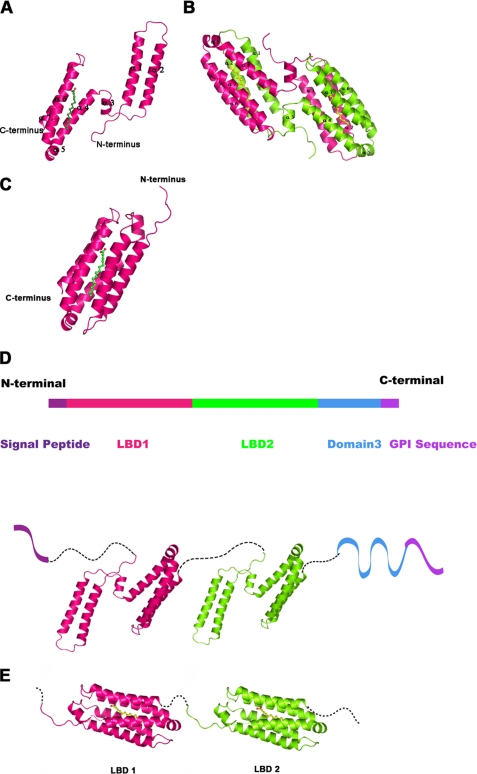
FIGURE 2.
Overall structure of the Mp1p LBD2, structural model for full-length Mp1p, and the possible conformation changes during ligand binding. A, a ribbon diagram of the LBD2 monomer. The ribbon diagram is shown with the protein molecule colored pink and the palmitic acid ligand colored green. B, a ribbon diagram of the LBD2 homodimer. The two protein molecules are colored pink and chartreuse, respectively, and palmitic acid is colored yellow. C, a schematic for the closed form of the ligand-bound LBD2 monomer. The LBD2 molecule is colored pink and shown in ribbon representation; palmitic acid is colored green. The crystal structure of the LBD2 dimer is used as a model for the closed form conformation. D, a structural model for full-length Mp1p. The N-terminal signal peptide and C-terminal glycosylphosphatidylinositol sequence are colored purple. LBD1 and LBD2 are colored pink and green, respectively, and are shown in cartoon using the crystal structure of LBD2. The third domain is colored blue. The model is a schematic of Mp1p structure, not an interpretation of the real domain interactions in full-length protein. E, a schematic diagram for the possible conformation of Mp1p LBD1 and LBD2 domains bound with palmitic acid. The two LBD domains are colored pink and green, respectively, and palmitic acid molecules are colored yellow.

