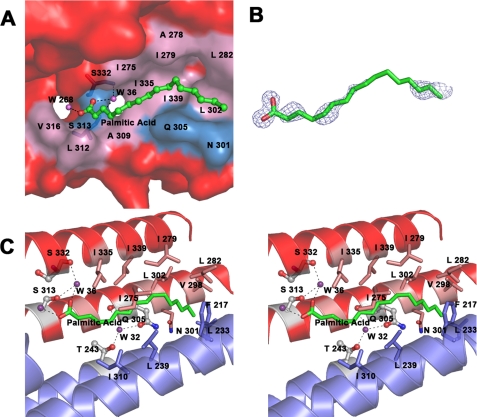
FIGURE 4.
A, surface representation of Mp1p LBD2 in complex with palmitic acid. Palmitic acid is shown in ball-and-stick representation and colored by atom type (carbon in green and oxygen in red.) Water molecules are shown as purple spheres. Residues at the ligand binding site are labeled; the surface is colored pink for hydrophobic residues and blue for the rest. Surface residues outside the ligand binding site are colored red. Residues involved in hydrogen bonding networks are shown in stick representation. The dashed lines show the hydrogen bonds between the residues and water molecules. B, palmitic acid overlaid by a 2Fo − Fc electron density map contoured at 1.0 σ. Palmitic acid is shown in stick representation and colored by atom type (carbon in green and oxygen in red). The density map comes from the original single-wavelength anomalous diffraction phased map generated by RESOLVE. C, stereo view of the ligand binding site of Mp1p LBD2. Palmitic acid is colored by atom type (carbon in green and oxygen in red). Water molecules are shown as purple spheres. Residues involved in hydrogen bonding networks are shown in ball-and-stick representation and colored by atom type (carbon in white, oxygen in red, and nitrogen in blue). Residues forming hydrophobic interactions with palmitic acid are colored by atom types (carbon in pink and blue for subunits A and B, respectively; oxygen in red; and nitrogen in blue). The helixes are shown as a ribbon diagram and colored red and blue for subunits A and B, respectively. The dashed lines show the hydrogen bonds between the residues and water molecules.

