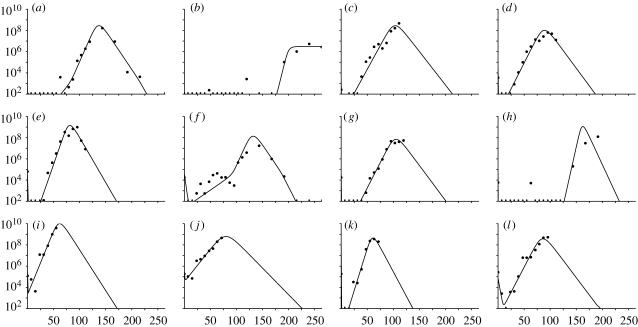
Figure 3.
Graphs showing the FMDV genomes ml−1 of serum against time (h) for the model fitted individually to each animal. Values below the threshold of 102 FMDV genomes ml−1 are marked with a dash. (a) UQ10, (b) UQ11, (c) UQ12, (d) UQ13, (e) UQ14, (f) UQ15, (g) UQ16, (h) UQ17, (i) UQ18, (j) UQ19, (k) UQ20 and (l) UQ21.

