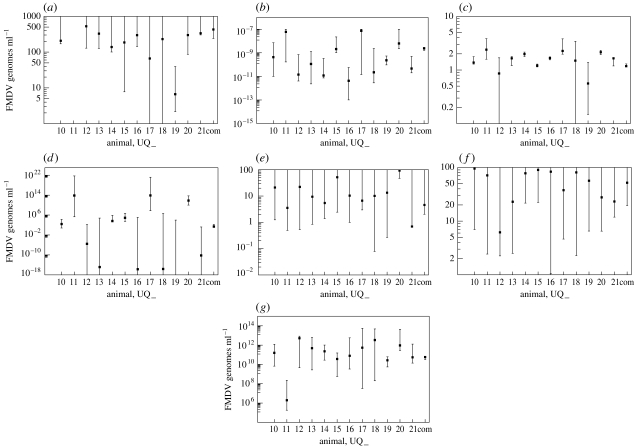
Figure 6.
Parameter 95% CIs for parameter estimates for each animal UQ_, and the common fit denoted by ‘com’. (a) Interstitial space virus clearance rate, ly (h−1), (b) interstitial-to-cell infection rate, hy (genomes−1 ml h−1), (c) cell-to-cell infection, hf (cell−1), (d) reduced infection, m (genomes ml−1), (e) blood-to-interstitial space rate, kxy (h−1), (f) interstitial space-to-blood rate, kyx (h−1) and (g) virus released cell−1 (proportion of total), b (genomes ml−1 cell−1).

