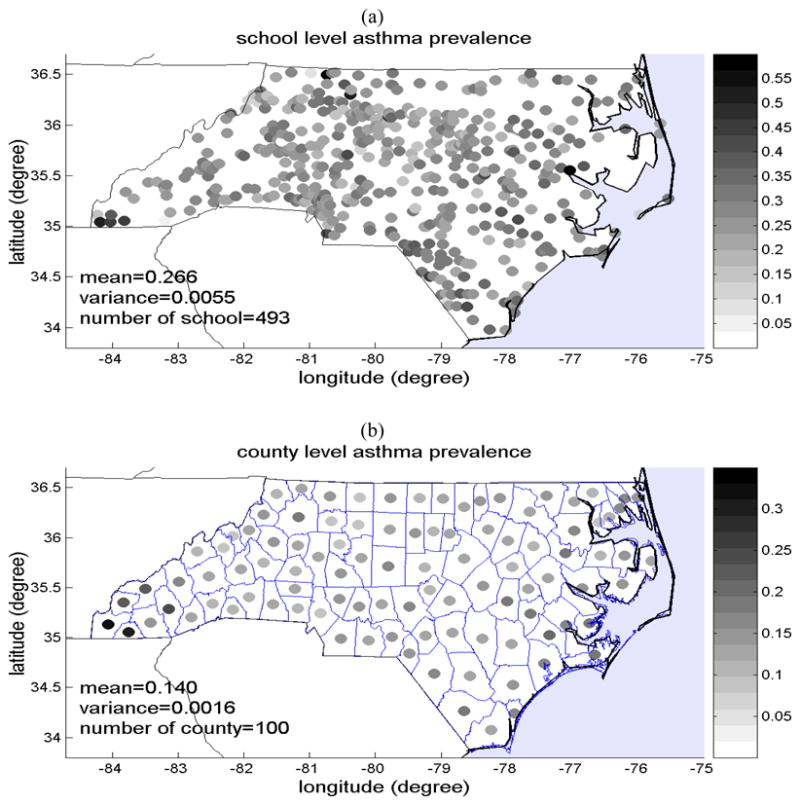
Figure 1.

Map showing (a) the data on asthma symptoms prevalence among high school children (age 13–14) reported in the NCSAS database for most of NC schools, and (b) the county level asthma prevalence data extracted from the database of Medicaid-enrolled children age 0–14 years who suffered from asthma. The prevalence is expressed as a fraction (i.e. average childhood asthma cases per 1 child) according to the color bar next to each map.
