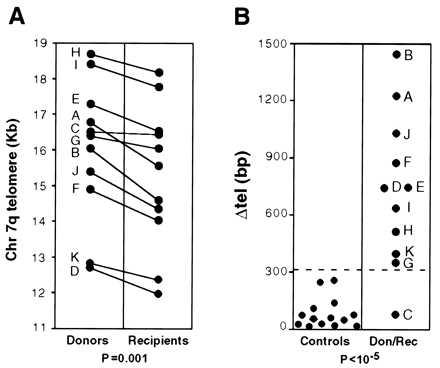
Figure 3.

Shortening of telomere (ΔTEL) after BMT. (A) The differences in telomere size between the paired DNA samples in the original donor and in the recipient after BMT are shown by individual straight lines. Each pair is indicated by a capital letter (see Table 1). Each data point represents the average of three determinations. The donor–recipient difference, analyzed by the Wilcoxon rank sum test for paired samples, is highly significant (P = 0.001). (B, Left) A scattergram of the difference in telomere length measured between two aliquots of the same DNA sample that were run side by side; in these controls, the apparent difference in telomere length was 81.5 ± 80 bp (range: 13–256 bp). (Right) The ΔTEL values for each donor–recipient pair (indicated by a capital letter, see Table 1) also are displayed as a scattergram. The broken line across the entire figure (3 SD above the mean of control data) is taken to be the threshold of background of our method of analysis. In 10 of 11 donor–recipient pairs, ΔTEL is above the threshold (P < 10−5, Fisher’s exact test). Don, donor; Rec, recipient.
