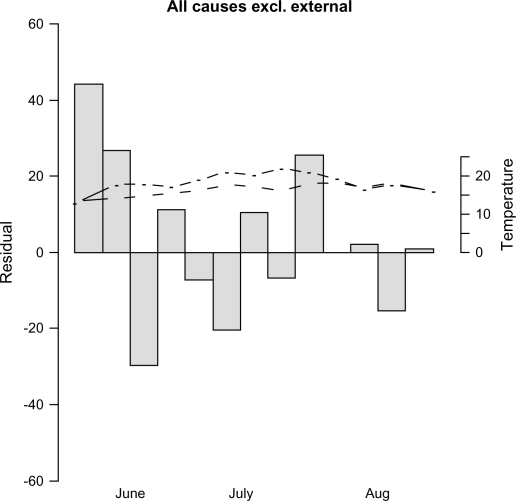
Fig. 5.
The observed weekly count of hospital admissions in summer 2006 subtracted from the predicted count from the time series regression model with smooth functions describing excess risks during the heat event, also corresponding to the model residuals during summer 2006. The dot-dashed line corresponds to weekly mean temperatures during summer 2006 and the dashed line to the weekly mean temperatures during the two preceding summers.

