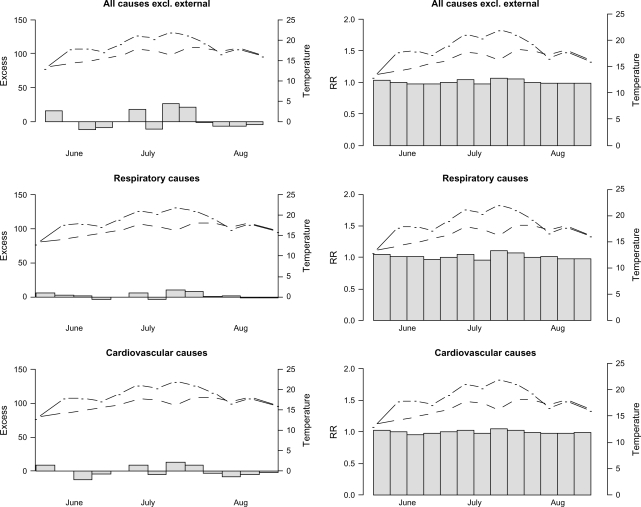
Fig. 6.
To the left; weekly admissions in summer 2006 attributed to daily variation of temperature compared with mean temperature levels in 2004 and 2005. The model incorporates smooth functions of temperature effect in lag strata 0–1, 2–6 and 7–13, and to the right; corresponding risks relative to the risk attributed to mean daily temperatures of 2004–2005. The dot-dashed lines correspond to weekly mean temperatures during summer 2006 and the dashed lines to the weekly mean temperatures during the two preceding summers.

