
Figure 1.
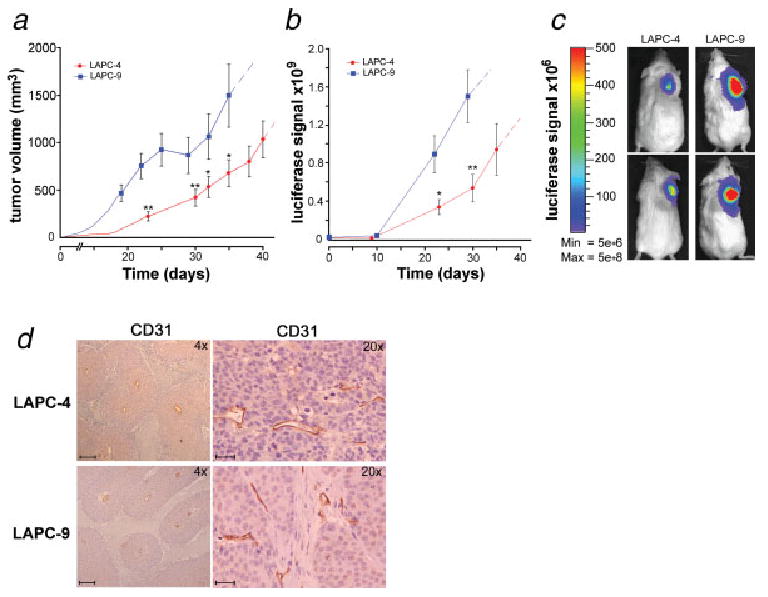
Prostate cancer xenograft models: optical imaging of tumor growth. LAPC-4 and LAPC-9 human tumor cells were implanted in immune-deficient mice (n = 10). Tumor volume was measured (a) and the luciferase reporter gene (FL) activity assayed via in vivo optical imaging (b). Blue color = LAPC-9 group; red color = LAPC-4 group. Dashed extensions of the curves represent projected values after tumors had been surgically removed in the majority of animals in a group. Representative examples of the tumor-derived optical signal in LAPC-4- and LAPC-9-bearing mice at day 20 postimplantation are shown (c). The color bar indicates the intensity range of the bioluminescence signal (p/s/cm2/sr). The tumors were surgically removed within 4–7 weeks postimplantation. Immunohistochemical staining of blood vessels in tumor sections revealed no difference in vascularity between the groups (d; ×4 and ×20). Scale bars = 200 and 50 μm, respectively.