
Figure 2.
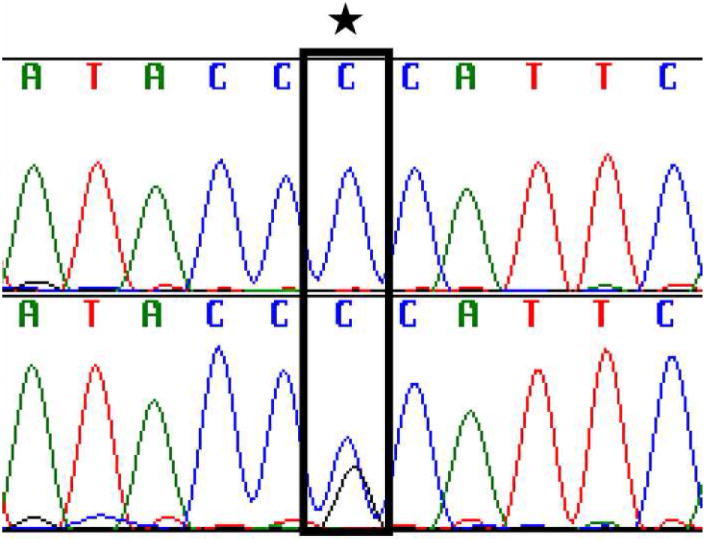
Chromatogram of a portion of PSEN1 exon 5 sequence. This displays a base pair change (P117A; bottom) compared to the family control (top).
Official websites use .gov
A
.gov website belongs to an official
government organization in the United States.
Secure .gov websites use HTTPS
A lock (
) or https:// means you've safely
connected to the .gov website. Share sensitive
information only on official, secure websites.
Chromatogram of a portion of PSEN1 exon 5 sequence. This displays a base pair change (P117A; bottom) compared to the family control (top).