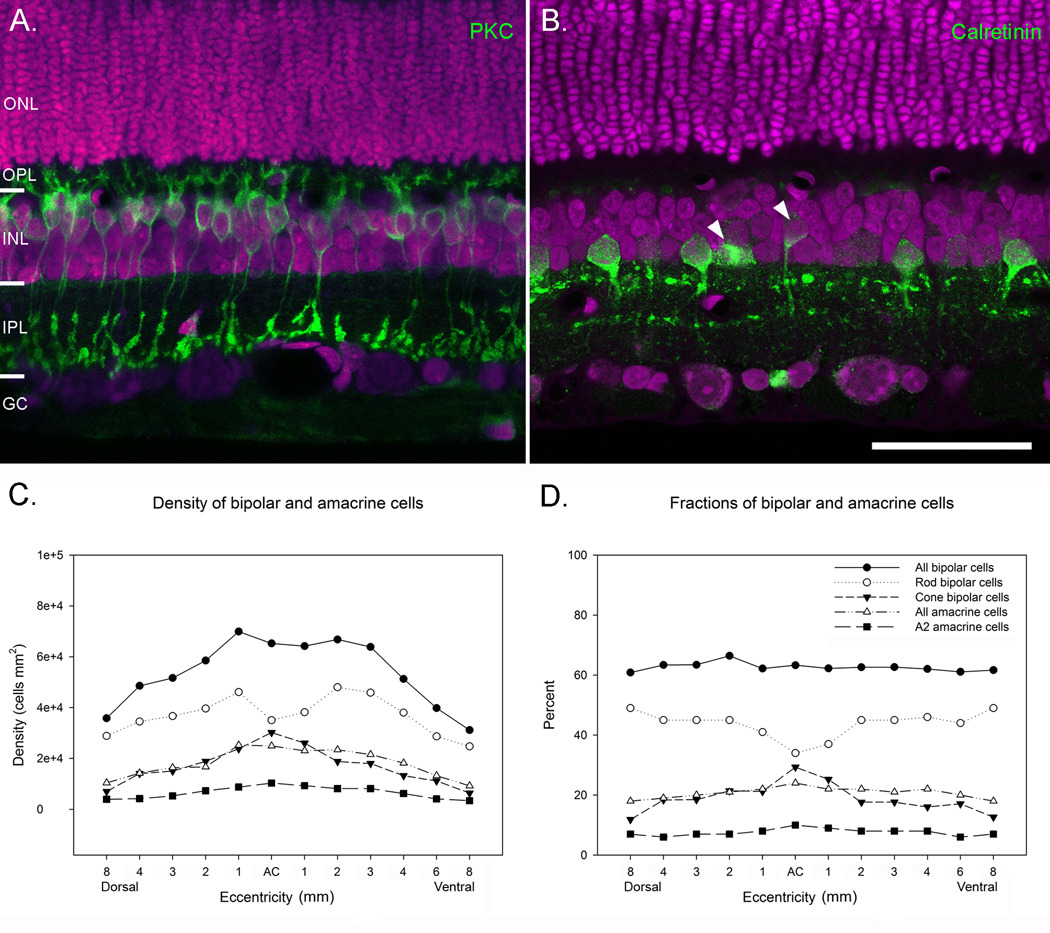
Figure 5.
A. A retinal section stained with an antibody against PKC, to label rod bipolar cells (green) and ethidium homodimer (magenta), to label all cell nuclei. PKC labeled approximately 44% of all cells in the INL. B. A retinal section stained with rabbit anti-calretinin to label AII amacrine cells (green) and ethidium homodimer (magenta). Calretinin stained approximately 7% of all INL cell nuclei. Occasionally, bipolar cells and non-AII amacrine cells were stained also (arrowheads). C. Graph shows the densities of bipolar and amacrine cells across the INL. There was a decline in the numbers of rod bipolar cells in area centralis and a corresponding increase in the numbers of cone bipolar cells. D. Graph shows the percent of bipolar and amacrine cells at different eccentricities across the retina. Scale = 50 µm.

