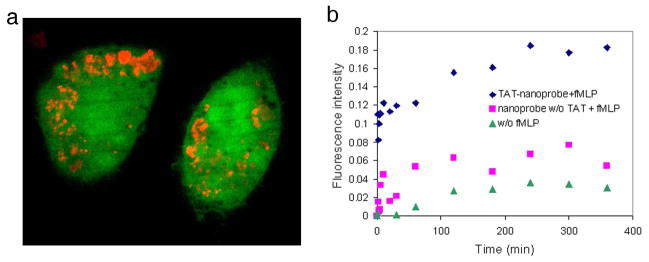
Figure 2.
In vitro H2O2 detection performed with DCFDA nanoprobes. a) Confocal image showing cellular uptake of DCFDA nanoprobes. The nanoprobes were incubated with RAW264.7 macrophage cells overnight. The nanoprobes were delivered to the cytosol by the TAT peptide function. The cells were stained by Calcein-AM (green colored, ex: 488 nm, em: 525 nm) and the nanoprobes were visualized by a secondary label, Alexa 568 (red colored, ex: 568 nm, em: 600 nm). b) Fluorescence increase over time due to H2O2 generation from macrophages upon stimulation with fMLP: TAT-conjugated nanoprobes (◆), control without TAT (■), and control without stimulation (▲). The DCFDA nanoprobes showed a significantly larger increase of fluorescence from stimulated cells than from the control (caused by auto-oxidation or natural H2O2 generation).

