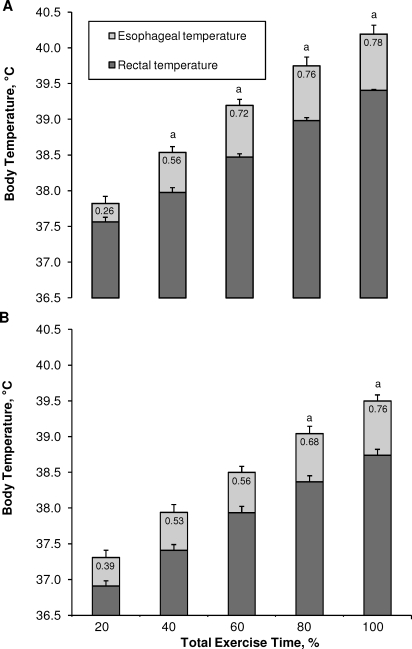
Figure 2.
Differences between esophageal and rectal temperatures as a function of percentage of total exercise time during exertional heat stress as defined by A, an esophageal temperature of 39.5°C or B, a rectal temperature of 39.5°C. Values are mean ± standard error for 12 participants. a Indicates different from 20% of total exercise time (P < .05).

