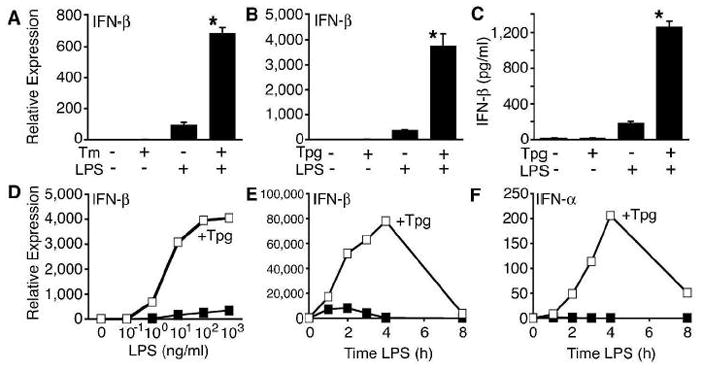
Figure 1.

Synergistic induction of type I IFN in macrophages undergoing an unfolded protein response. RAW267.4 macrophages were pretreated with Tm for 8 h (A) or Tpg for 1 h (B) then stimulated with LPS (10 ng/ml) for 2 h prior to RNA isolation and quantitative PCR (qPCR) analysis for IFN-β transcripts. (C) RAW264.7 macrophages were treated with Tpg for 1 h, then LPS was added for an additional 24 h prior to collection of supernatants for IFN-β ELISA. (D) RAW264.7 cells were pretreated with Tpg for 1 h then dilutions of LPS for 3 h. (E, F) Rat BM derived macrophages were pre-treated with Tpg for 1 h then LPS for the times indicated. In (C, E, F), ν represents LPS only, and  indicates Tpg plus LPS. IFN transcript levels were measured with qPCR and are shown normalized to GAPDH. Results shown are means ±SD (A–C) and are representative of 4 (Tm) or 5 (Tpg) experiments. Asterisks (*) indicate p<0.05 for average fold induction for LPS plus Tpg (or Tm) vs. LPS alone, from combined experiments. Concentration curve and time course (D–F) are representative of two experiments.
