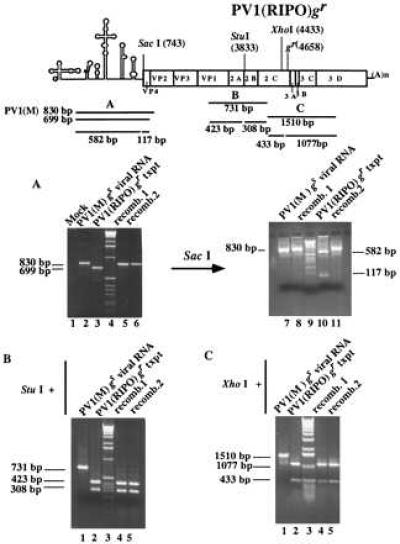
Figure 3.

RT-PCR and restriction analyses of representative cell-free recombinants generated in this study. Reverse transcription was carried out by using AMV reverse transcriptase (Boehringer Mannheim) and random nonamers. The cDNAs were amplified with Taq DNA polymerase (Boehringer Mannheim) by using specific primers. At the top is a schematic representation of PV1(RIPO)gr, showing the gr mutation and various restriction sites used as neutral markers. The concentration of all agarose gels shown here is 0.8%, except the one on the right in A, which is 2.5% to detect the small RT-PCR fragment released after cleavage with SacI. (A) Analysis in the IRES region. Lanes 4 and 9, DNA molecular weight marker. (B) Analysis to show the presence of a StuI site in the RT-PCR products. Lane 3, DNA molecular weight marker. (C) Analysis of the nonstructural protein region containing the gr mutation. Lane 3, DNA molecular weight marker.
