Figure 2.
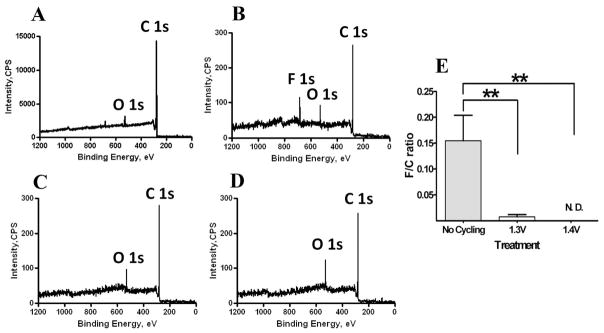
XPS spectra of PPF electrode surfaces. F 1s, O 1s and C 1s indicate characteristic peaks for fluorine, oxygen and carbon, respectively. (A) PPF electrode before any treatment. (B) PPF electrode after coating with silicon nitride, removal of insulation by etching with CHF3/O2 and subsequent immersion in buffer solution. (C, D) PPF electrode after 30 minute treatment with the 1.3 V waveform and the 1.4 V waveform, respectively. Each waveform was repeated at 60 Hz. (E) Summary of F/C atomic ratios for PPF electrodes before treatment and after 1.3 V, and 1.4 V treatments. N. D. – no fluorine was detected; double asterisk represents p < 0.01 for one way variance ANOVA statistical test (n = 4 for each condition).

