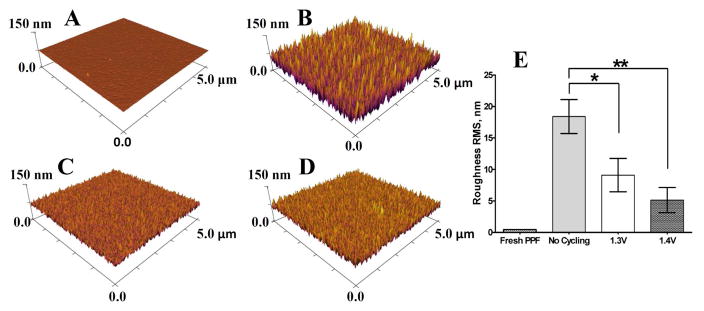
Figure 3.
AFM images of the PPF electrode surface morphology after different treatment conditions. (A) PPF electrode before any treatment. (B) PPF electrode after coating with silicon nitride, removal of insulation by etching with CHF3 and subsequent immersion in buffer solution. (C, D) PPF electrodes prepared as for (B) but following 30 minute treatment with the 1.3 V waveform and the 1.4 V waveform, respectively. Each waveform was repeated at 60 Hz. (E) Summary of surface roughness for PPF electrodes before treatment and after 1.3 V, and 1.4 V treatments. Single and double asterisks represent p < 0.05 and p < 0.01, respectively, for one way variance ANOVA statistical test (n = 3 for each condition).

