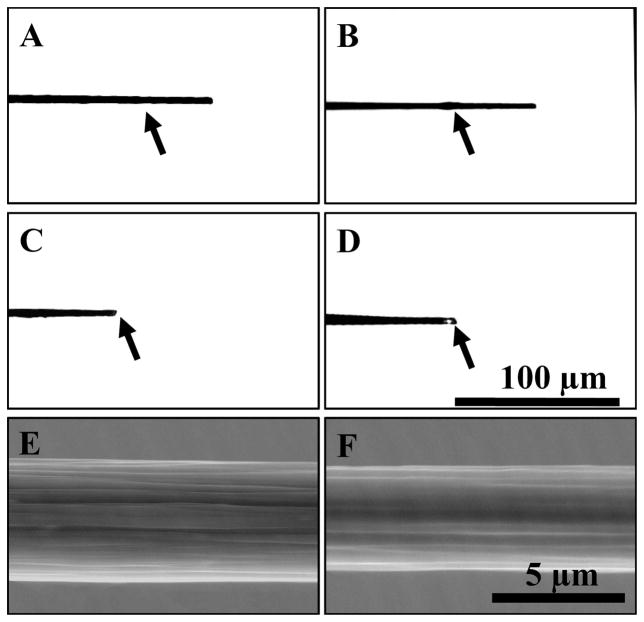
Figure 5.
Images of carbon fiber microelectrodes after prolonged treatment with the extended waveforms. Optical microscopy (A–D) and SEM (E and F) images display the disappearance of the carbon fiber tip after electrochemical etching. The black arrow indicates the location of the end of the glass seal. A carbon fiber microelectrode before treatment (A) and after 65 hours (B) of treatment with the 1.0 V waveform at 60 Hz. Treatment with the 1.3 V waveform for 65 hours at 60 Hz (C) and for 6 hours at 60 Hz with the 1.4 V waveform (D) led to the disappearance of the carbon fiber. SEM imaging of T-650 carbon fiber cylinder microelectrodes showed a 0.9 ± 0.4 μm (n = 4) reduction in diameter of the carbon fiber after 30 hr of treatment with the 1.3 V waveform. The same carbon fiber before (E) and after (F) such treatment.

