Fig. 7.
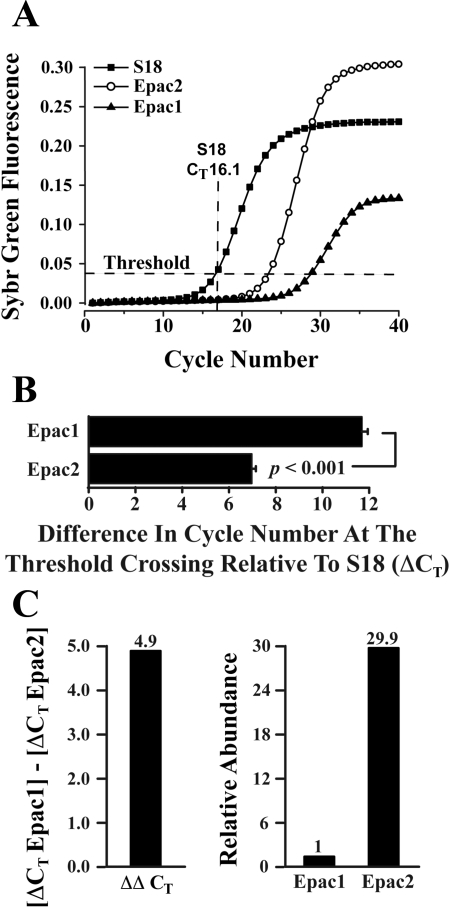
RT-quantitative PCR (QPCR) for Epac1 and Epac2. A: RT-QPCR fluorescence growth curves obtained using 100 ng of human islet RNA in a single PCR reaction from islets of a single donor. Ribosomal S18 mRNA was used as the reference target for quantification of Epac1 and Epac2 mRNA. The threshold crossing value (CT) for S18 mRNA (16.1) is indicated. B: comparison of ΔCT values obtained after averaging results of PCR reactions run for Epac1 (ΔCT 11.83 ± 0.31; 10 reactions) and Epac2 (ΔCT 6.93 + 0.39; 13 reactions). The ΔCT value for each Epac isoform was calculated as the difference in threshold cycle number relative to S18. C: the ΔΔCT value (4.9) for Epac1 relative to Epac2 was computed by subtraction of the ΔCT values for each isoform (left), and the relative abundance of Epac1 and Epac2 mRNA was then calculated to be 1:29.9 (right). Results in B and C are based on averaged data obtained using 2 batches of islets from 2 donors.

