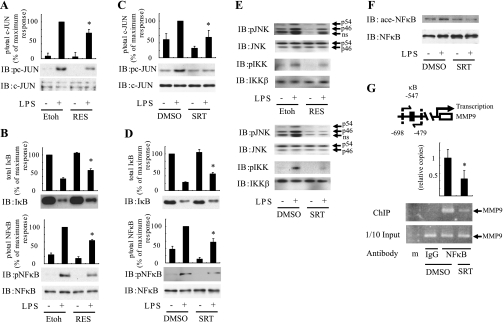
Fig. 1.
SIRT1 activators inhibit LPS-stimulated inflammatory pathways. After pretreatment of 50 μM resveratrol (RES; A, B, and E) or 1 μM SRT1720 (C–G) for 1 h, RAW264.7 cells (A–D, F and G) or peritoneal macrophage (E) were stimulated with (+) or without (−) 100 ng/ml LPS for 10 min (A–E) or 1 h (F and G) and lysed, and immunoblotting (IB) was performed with indicated antibodies. Scanned bar graphs show means ± SE, and values are expressed as %maximum compared with those observed in LPS-stimulated control cells (n = 3). G, top: schematic diagram of the mouse MMP9 promoter region. The positions of κB sites are indicated and pairs of arrows indicate the PCR-amplified regions. Soluble chromatin was immunoprecipitated with anti-NF-κB antibody (NF-κB) or control IgG (IgG). Enrichment of κB containing DNA sequences in the immunoprecipitated DNA pool was visualized by PCR. G, bottom: PCR-amplified MMP9 promoter band from input control. Graph shows mean ± SE from 3 independent experiments, and values are expressed as fold amount of immunoprecipitated promoter DNA copy numbers relative to their corresponding input controls, compared with those observed DMSO-treated cells. *P < 0.05, Etoh or DMSO vs. resveratrol or SRT1720. Etoh or DMSO, vehicle ethanol or DMSO control; p/total, phosphorylation/total; ns, nonspecific; ChIP, chromatin immunoprecipitation; ace, acetylation; m, marker.

