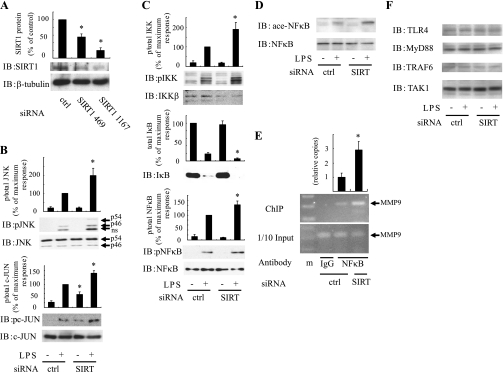
Fig. 2.
SIRT1 knockdown increases inflammatory responses. A: RAW264.7 macrophages were electroporated with control (ctrl) or SIRT1 (SIRT1) siRNA. Forty-eight hours after electroporation, cell lysates were immunoblotted with indicated antibodies. B–F: cells were electroporated with control or SIRT1 (SIRT) siRNA. Forty-eight hours after electroporation, cells were stimulated with or without 100 ng/ml LPS for 10 min (B, C, and F) or 1 h (D and E), and Western blotting was performed with indicated antibodies. Data are percentages compared with ctrl siRNA electroporated cells and are means ± SE (n = 3). E, top: soluble chromatin was immunoprecipitated with anti-NFκB antibody or control IgG . Enrichment of κB containing DNA sequences in the immunoprecipitated DNA pool was visualized by PCR. E, bottom: PCR-amplified MMP9 promoter band from input control. Graph shows mean ± SE from 3 independent experiments, and values are expressed as fold amount of immunoprecipitated promoter DNA copy numbers relative to their corresponding input controls, compared with those observed DMSO-treated cells. *P < 0.05, control siRNA vs. SIRT1 siRNA.

