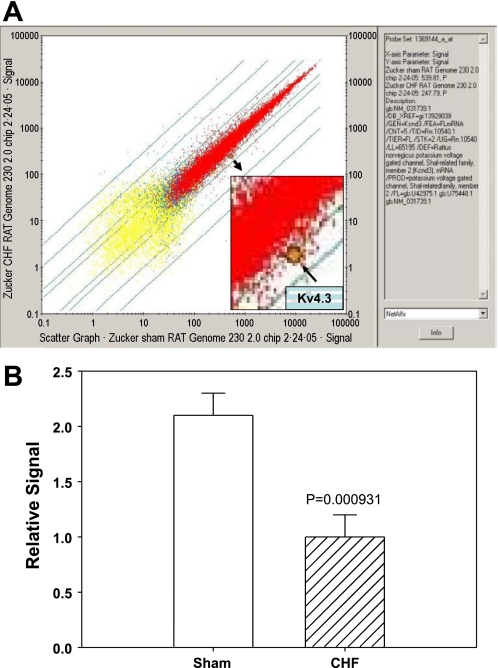
Fig. 1.
Gene expression analysis of chronic heart failure (CHF) and sham medulla using the Affymetrix microarray chip (rat genome 230). A: scatter plot of gene expression comparisons from one CHF and one sham rat medulla. Each point represents a single gene or expressed sequence tag. Horizontal axis: sham rat; vertical axis: CHF rat; highlighted point represents the Kv4.3 gene, showing the decreased mRNA expression in CHF rat compared with sham. B: group data for microarrays shows the decrease in Kv4.3 gene expression in the medulla of CHF rats compared with sham. Values are means ± SE; n = 3 pairs. *P < 0.05.

