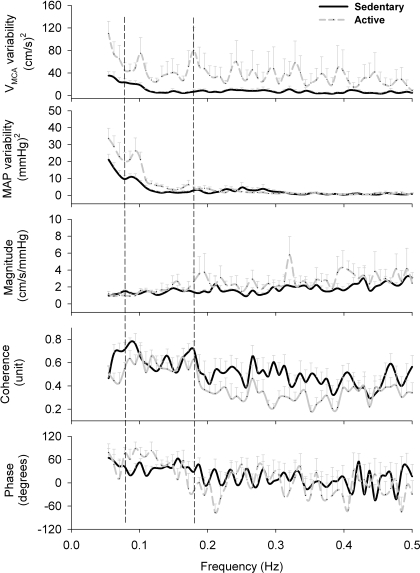
Fig. 1.
Baseline power spectral data (from top to bottom) of middle cerebral arterial blood flow velocity (VMCA) variability, mean arterial pressure (MAP) variability, and their transfer function magnitude, coherence, and phase between VMCA-MAP signals. Baseline transfer function analysis data were not significantly different between the two groups, i.e., the sedentary group (SED) vs. the physically active (ACT) group: 1.41 ± 0.18 vs. 1.65 ± 0.44 cm·s−1·mmHg−1 (P = 0.62), 0.63 ± 0.06 vs. 0.56 ± 0.05 units (P = 0.111), and 38.03 ± 6.57 vs. 48.55 ± 11.84° (P = 0.44), respectively. However, both VMCA variability and MAP variability were significantly greater in ACT subjects than in SED elderly subjects. The two vertical dashed lines define the spectrum between 0.08 and 0.18 Hz from where the frequency-domain data were extracted and compared between the groups. Two SED subjects and two ACT subjects have coherence < 0.5; their data were excluded from transfer function analysis. Therefore, the number of subjects in the data of VMCA variability and MAP variability was n = 10 and 9, whereas for the transfer function magnitude, coherence, and phase, the number of the subjects was n = 8 and 7, in the SED and ACT groups, respectively.

