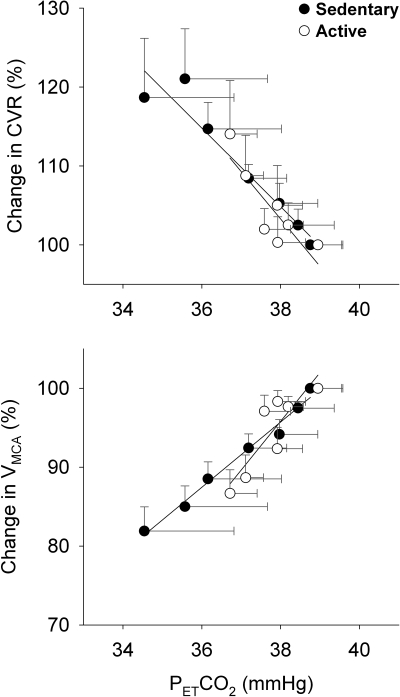
Fig. 5.
Slopes of %ΔCVR/PetCO2 (top) and %ΔVMCA/PetCO2 (bottom) during graded LBNP. Although hypocapnia was greater in the SED subjects than in the ACT subjects, neither the slopes of %ΔCVR/PetCO2 (P = 0.5519, −4.98 ± 0.64%/mmHg, R2 = 0.92, vs. −6.01 ± 1.65%/mmHg, R2 = 0.73) nor the slopes of %ΔVMCA/PetCO2 (P = 0.1442, 4.14 ± 0.24%/mmHg, R2 = 0.98, vs. 6.19 ± 1.58%/mmHg, R2 = 0.75) were statistically different between the two groups.

