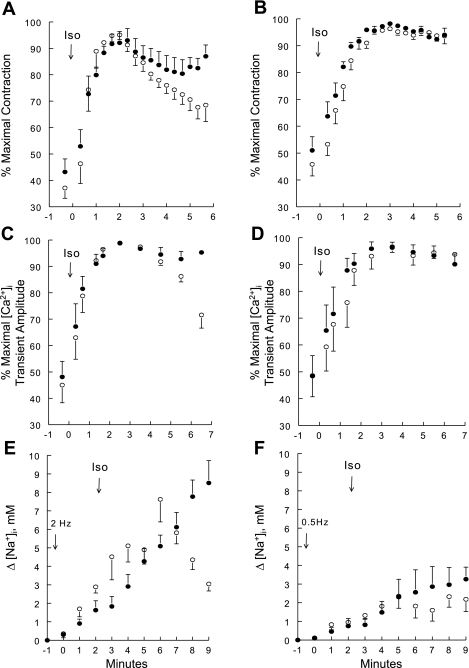
Fig. 3.
Contractility, intracellular Ca2+ concentration ([Ca2+]i) transient amplitudes, and increases in intracellular Na+ concentration (Δ[Na+]i) in Iso-stimulated WT and PLM-KO myocytes paced at 0.5 or 2 Hz. Contraction (A and B), [Ca2+]i transients (C and D), and Δ[Na+]i (E and F) were measured in WT (○) and PLM-KO (●) myocytes at 37°C. Myocytes were paced at either 2 (A, C, and E) or 0.5 (B, D, and F) Hz. To facilitate comparison between myocytes, contraction and [Ca2+]i transient amplitudes are normalized to the maximum values observed for each myocyte. There are 6 WT (2 mice) and 6 PLM-KO (3 mice) myocytes in A; 10 WT (4 mice) and 6 PLM-KO (2 mice) in B; 8 WT (3 mice) and 6 PLM-KO (2 mice) myocytes in C; 7 WT (3 mice) and 5 PLM-KO (2 mice) in D; 5 WT (2 mice) and 7 PLM-KO (3 mice) myocytes in E; and 6 WT (2 mice) and 5 PLM-KO (2 mice) myocytes in F. In A–D, Iso (1 μM) was added at “time 0” (arrows) after steady-state contraction was achieved (usually 1–2 min after initiation of pacing). In E and F, after resting [Na+]i was obtained (at −1 min) pacing was initiated at “time 0” and Iso (1 μM) was added at ∼2 min after initiation of pacing. Error bars are not shown if they fall within the boundaries of the symbol.

