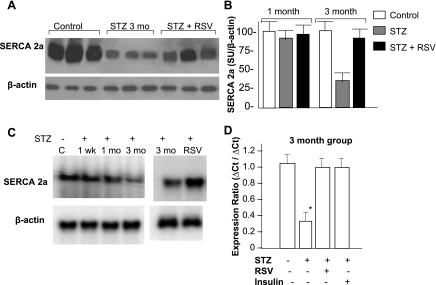
Fig. 3.
Analysis of sarcoplasmic calcium ATPase (SERCA) 2a expression. A: Western analysis; representative radiograms obtained from the cardiac tissue lysate of 3 mo control, diabetic (STZ), and RSV-treated diabetic (STZ + RSV) groups of animals. β-Actin was used as a loading control. B: semiquantitative analysis of SERCA2a levels after 1 and 3 mo of STZ injection. Band intensity measurements were done using Scion software. In each panel, the intensity of a given band was normalized to the intensity of the loading control (β-actin) of the respective band and expressed as means ± SD of 4–6 hearts analyzed in three separate experiments. C: Northern analysis of time course of changes in SERCA2a mRNA following 1 wk, 1 mo, and 3 mo of STZ injection and 3 mo following RSV treatment. Each lane represents pooled RNA of 3–5 hearts of each group. β-Actin was used as a loading control. D: real-time PCR analysis of total RNA from indicated group of animals. Expression ratios were calculated using the ΔΔCT method, where CT is cycle threshold, and β-actin as reference. Each bar represents mean values and SD of 5 hearts of each group. *P < 0.05 compared with the control group.

