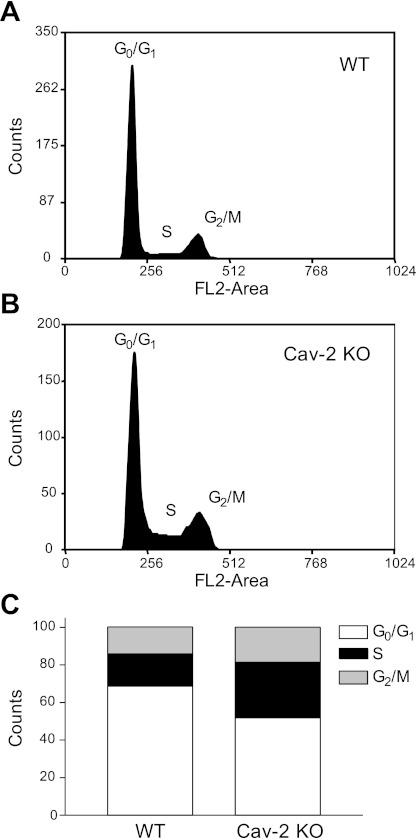
Fig. 3.
Increased association in hyperproliferating Cav-2 KO MLECs with S and G2/M phases and the concurrent decreased association with G0/G1 phases of cell cycle determined by flow cytometry. WT and Cav-2 KO MLECs were plated at 3 × 10⁵ per 150-mm dish, and 2 days later, harvested with trypsin, fixed in ethanol, stained with propidium iodide, and analyzed by flow cytometry using fluorescent channel 2 (FL2-area). Representative cell cycle profiles from one representative out of a total of 3 experiments are shown for WT (A) and Cav-2 KO MLECs (B). Quantitative assessment of the percentage of cellular population associated with each phase of the cell cycle is illustrated in C.

