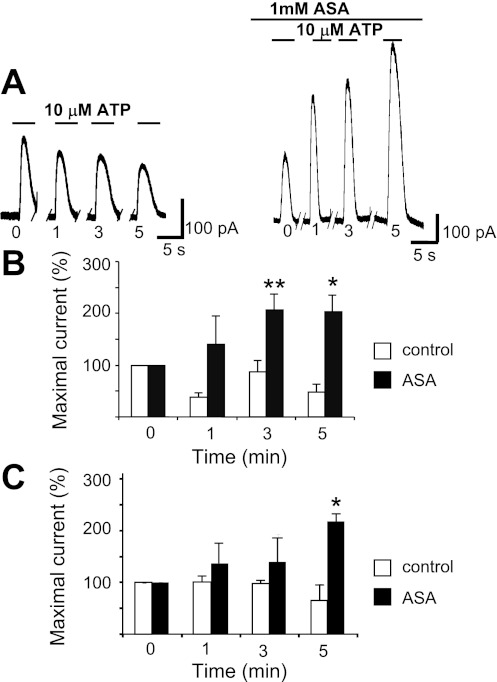
Fig. 4.
ASA reverses time-dependent degradation of purinergic receptor agonist-induced outward current in MKs. A: example of conventional whole cell patch-clamp recordings (VH = −40 mV) of 10 μM ATP-induced outward current comparing the action of 1 mM ASA (right) to control (left) on the first oscillatory response to that of subsequent application at distinct time intervals in minutes as indicated below each trace. B: ADP summary data. Each value represents current amplitude observed with each repeated application at subsequent times (1, 3, 5 min) normalized to that of the initial application of 10 μM ADP. Values are means ± SE for control n = 9 and ASA-treated n = 15 MKs. **P ≤ 0.01 at 3 min. *P < 0.05 at 5 min. C: ATP summary data. Results obtained with a similar protocol as in B. Values are means ± SE for control n = 8; ASA-treated n = 9 MKs. *P < 0.05 at 5 min.

