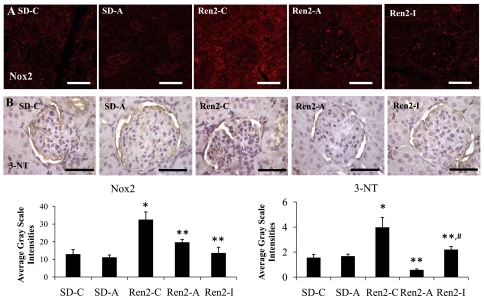
Fig. 3.
Semiquantitative analysis of oxidative stress in Ren2 cortical tissue. Representative images of immunohistochemistry analysis of kidney cortical tissue NADPH oxidase subunit Nox2 (A) and 3-nitrotyrosine (3-NT; B), as a marker for lipid peroxidative and oxidative stress, with corresponding average gray scale intensities below. Values presented as means ± SE. *P < 0.05 when Ren2-C (n = 5) are compared with SD-C (n = 5). **P < 0.05 when Ren2-A and Ren2-I (n = 5) are compared with age-matched Ren2-C. #P < 0.05 when Ren2-I are compared with Ren2-A. Scale bar = 50 μm.

