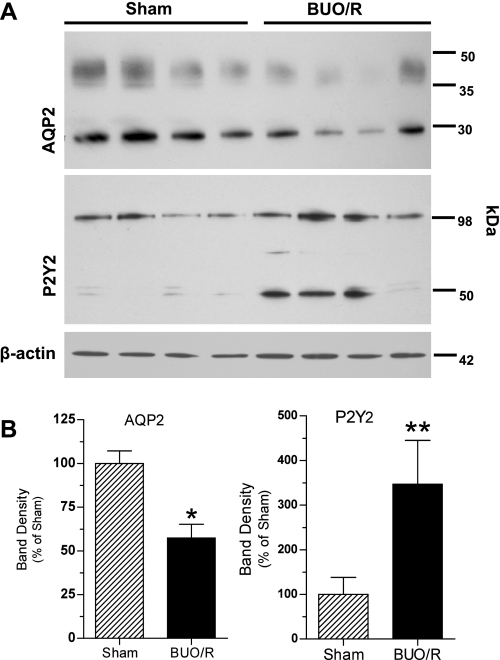
Fig. 2.
Changes in protein abundances of aquaporin-2 (AQP-2) and P2Y2 receptor in rat inner medulla during postobstructive uropathy. BUO/R and sham rats (n = 4/group) were euthanized on day 12. Whole inner medullary tissue samples were immunoblotted using specific antibodies to AQP-2 or P2Y2 receptor. A: immunoblots of AQP-2 and P2Y2 receptor in sham and BUO/R rats. Equal amounts of proteins from 1 rat per lane were loaded onto gels. Equality of protein loading was checked by staining loading gels with Coomassie blue or probing blots for protein abundance of β-actin. AQP-2 protein blots show 29-kDa native band and a smear of glycosylated band extending between 35 and 50 kDa. In P2Y2 receptor protein blots, 45- and 105-kDa bands are specific, as documented previously (21, 24, 49). B: densitometry of bands in immunoblots. Immunoblots were digitized, and pixel densities of the bands were determined. Combined density values (means ± SE) of 29- and 35- to 50-kDa protein bands of AQP-2 and 47- and 105-kDa protein bands of P2Y2 receptor in sham and BUO/R groups were normalized to density of respective β-actin bands. Results are plotted as percentage of mean values in the sham group. *P < 0.01; **P < 0.05 vs. sham.

