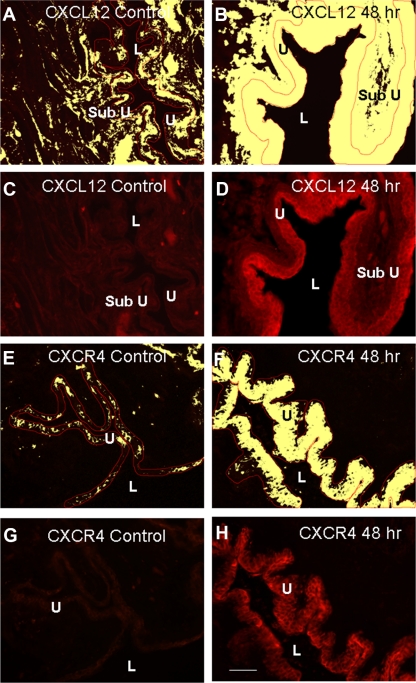
Fig. 4.
Regulation of CXCL12 (A–D) and CXCR4 (E–H) expression in cryostat sections of urinary bladder after CYP treatment. The urothelium was outlined in red, and images were thresholded (A, B, E, and F). All pixels above threshold are depicted in yellow. Corresponding fluorescence images of CXCL12 expression in control or after 48 h CYP treatment are shown in C and D, respectively. Fluorescence images of CXCR4 expression in urinary bladder of control or after 48 h CYP treatment are shown in G and H, respectively. L, lumen; U, urothelium; Sub U, suburothelium. Calibration bar represents 50 μm.

