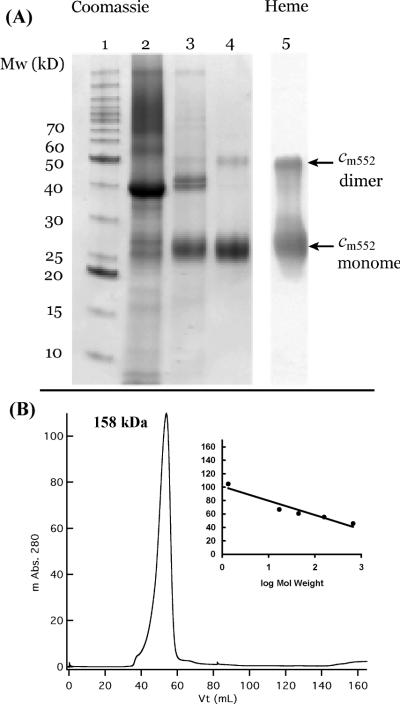
Figure 1.
Electrophoretic profile of cyt cm552 and oligomerization state of the purified product. (A) SDS–PAGE analysis of fractions during purification: lane 1, molecular mass standards; lane 2, Triton X-100-solubilized membrane fraction; lane 3, post-first anion-exchange chromatography (Macro-Prep DEAE) in the presence of Triton X-100; lane 4, post-second anion-exchange chromatography (Source Q)/detergent exchange with DDM and size exclusion (Toyopearl HW 55S) chromatography; and lane 5, heme stain of lane 4. (B) Gel filtration chromatography of purified cyt cm552 in the presence of the detergent DDM showing its oligomerization state. The inset shows column calibration with thyroglobulin (670 kDa), gamma globulin (158 kDa), ovalbumin (44 kDa), and myoglobin (17 kDa).

